Grimmett
| parameter | value |
|---|---|
| [Phenology].PpSensitivity.FixedValue | 5 |
| [Structure].BranchMortality.MortalityPhase.Mortality.MortalityPerDegDay.XYPairs.Y | 0.001,0 |
| [Grain].NumberFunction.GrainNumber.GrainsPerGramOfStem.FixedValue | 25 |
This report is generated for performance of Barley model in APSIM NG for cultivar Grimmett.
The cultivar specific parameters used in the simulation are listed in the table below:
Grimmett
| parameter | value |
|---|---|
| [Phenology].PpSensitivity.FixedValue | 5 |
| [Structure].BranchMortality.MortalityPhase.Mortality.MortalityPerDegDay.XYPairs.Y | 0.001,0 |
| [Grain].NumberFunction.GrainNumber.GrainsPerGramOfStem.FixedValue | 25 |
There are 5 experiments which tested cultivar Grimmett and its aliases in the validation test dataset of APSIM NG..
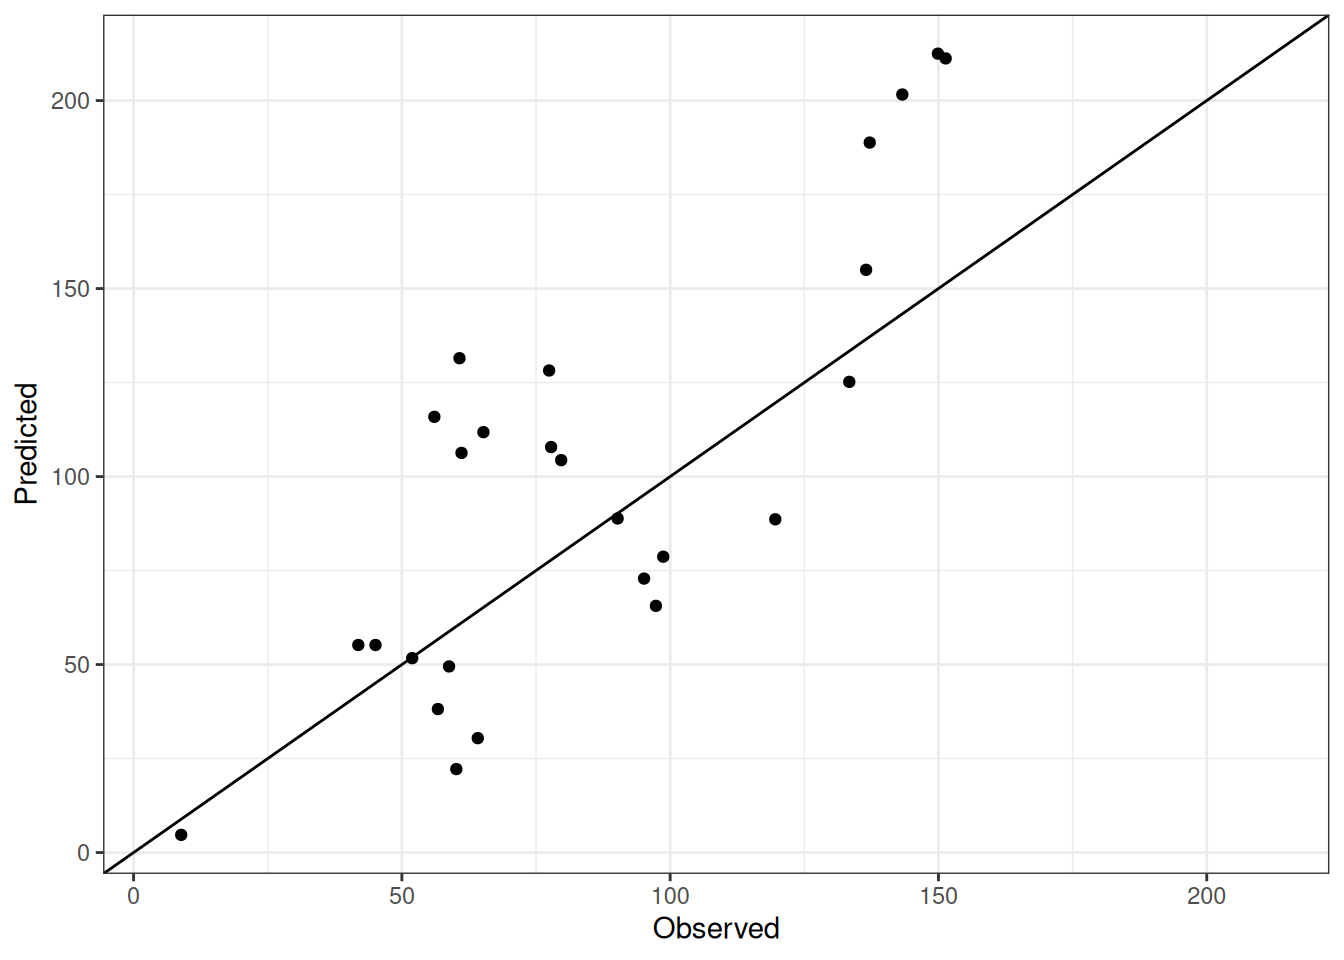
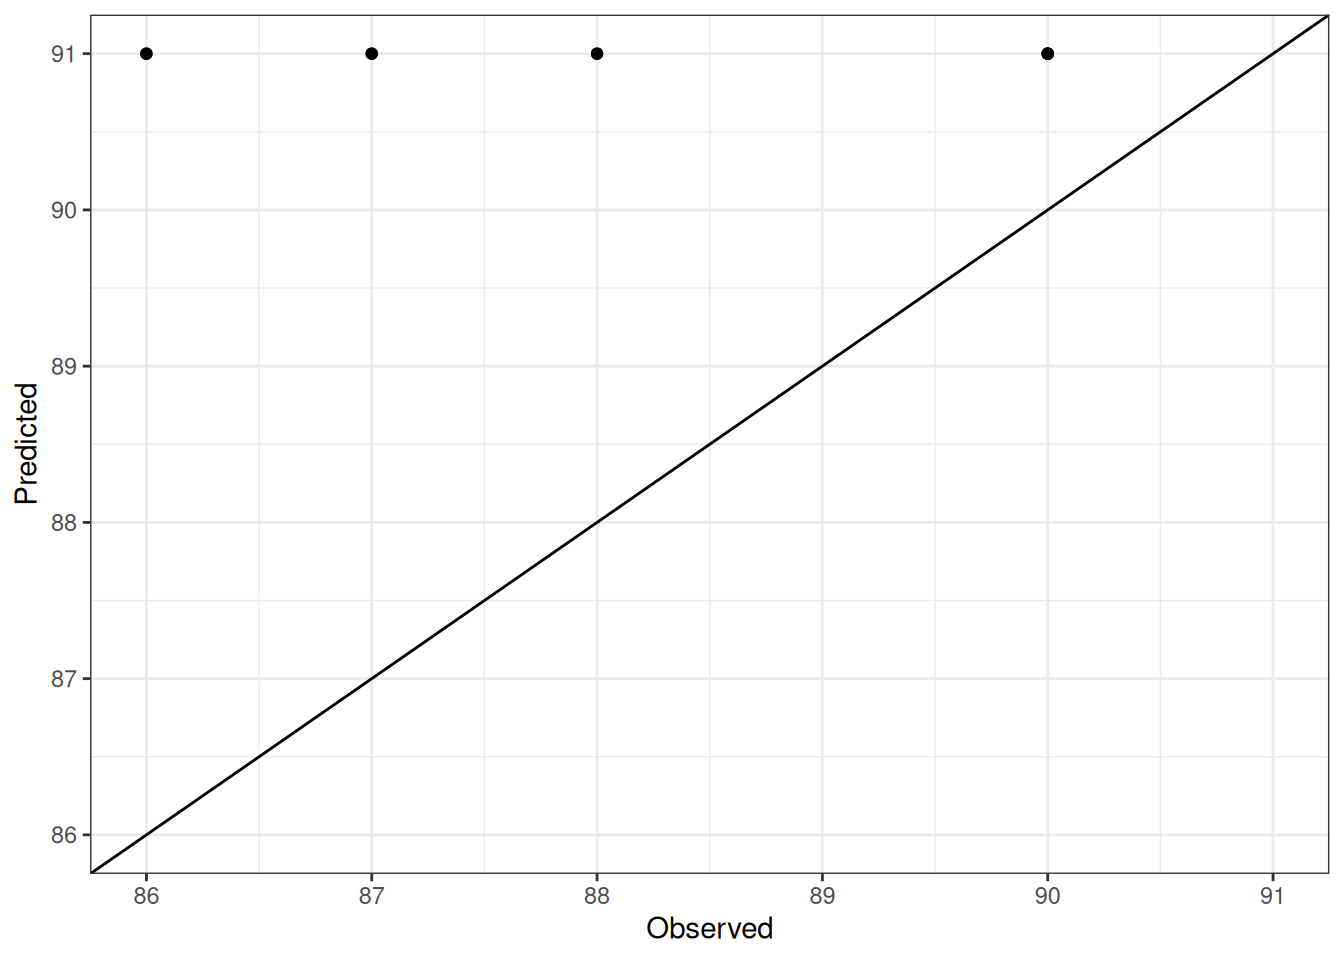
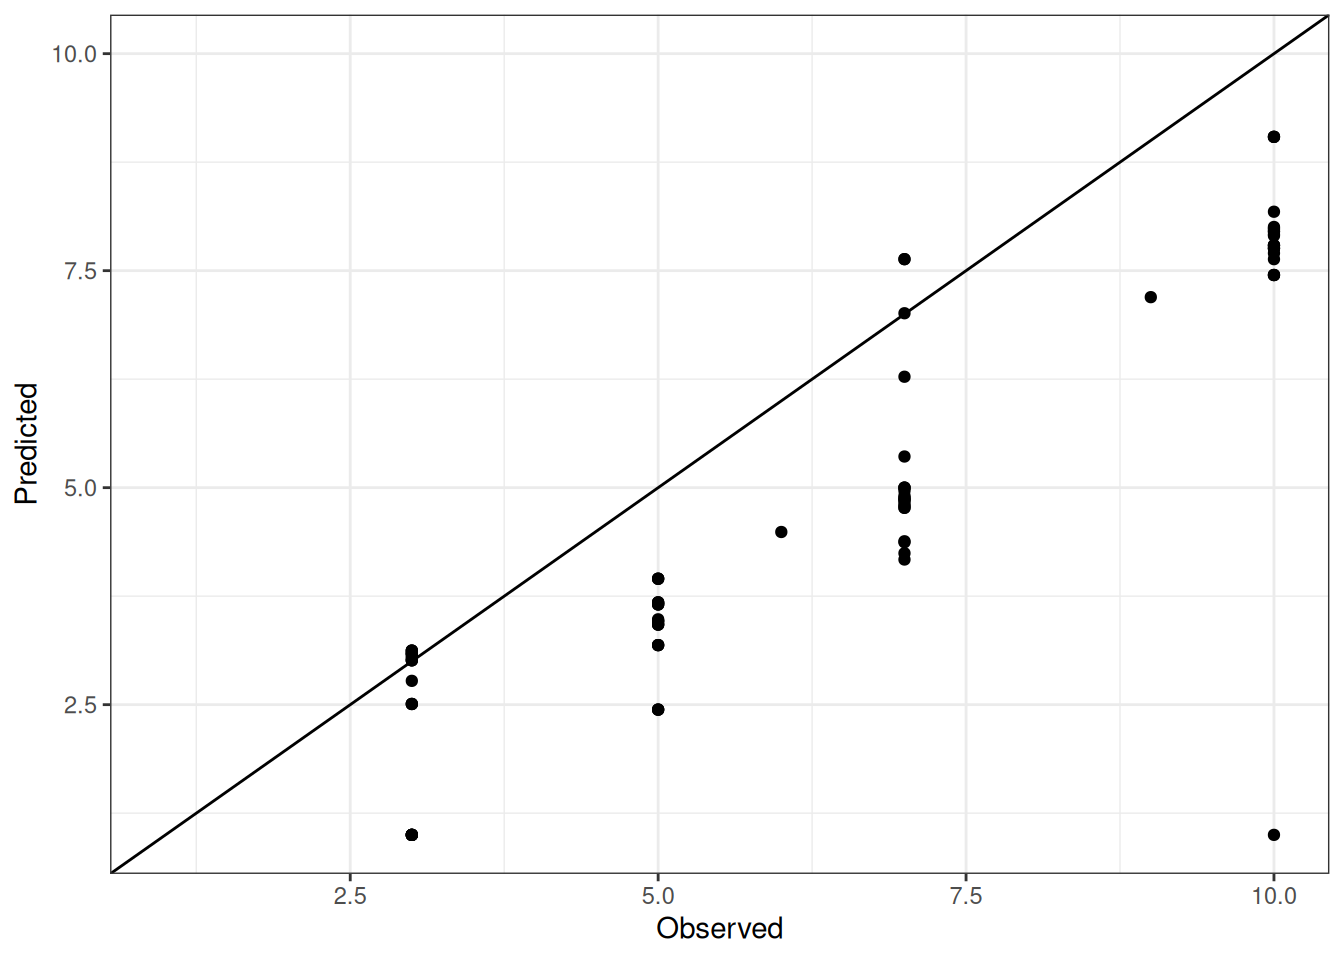
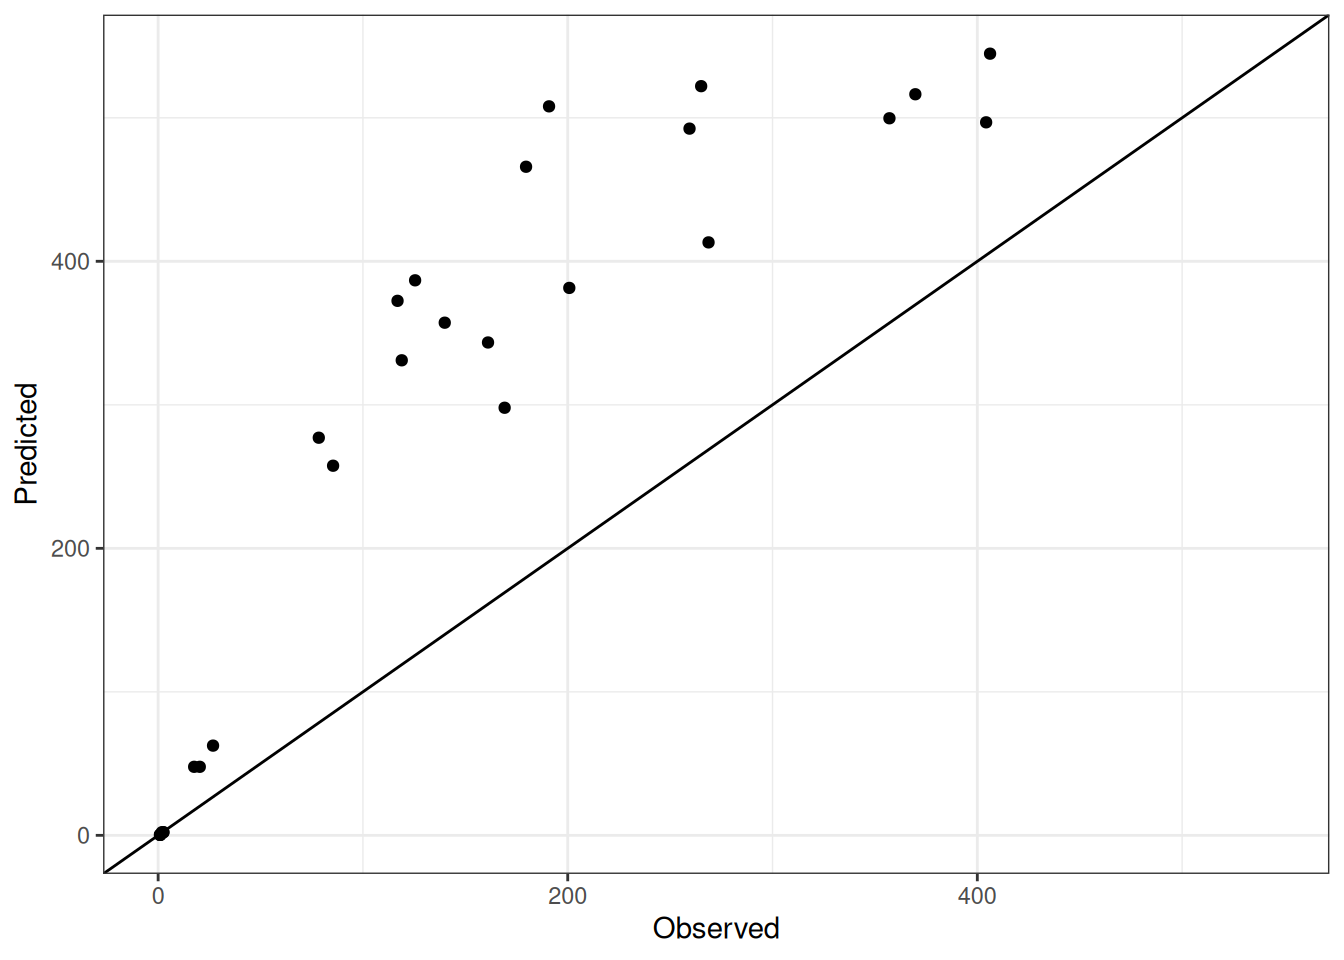
The table below summarizes the performance of APSIM NG for cultivar Grimmett across all experiments.
Grimmett
| trait | n | r | r2 | bias | mse | rmse | nrmse | d |
|---|---|---|---|---|---|---|---|---|
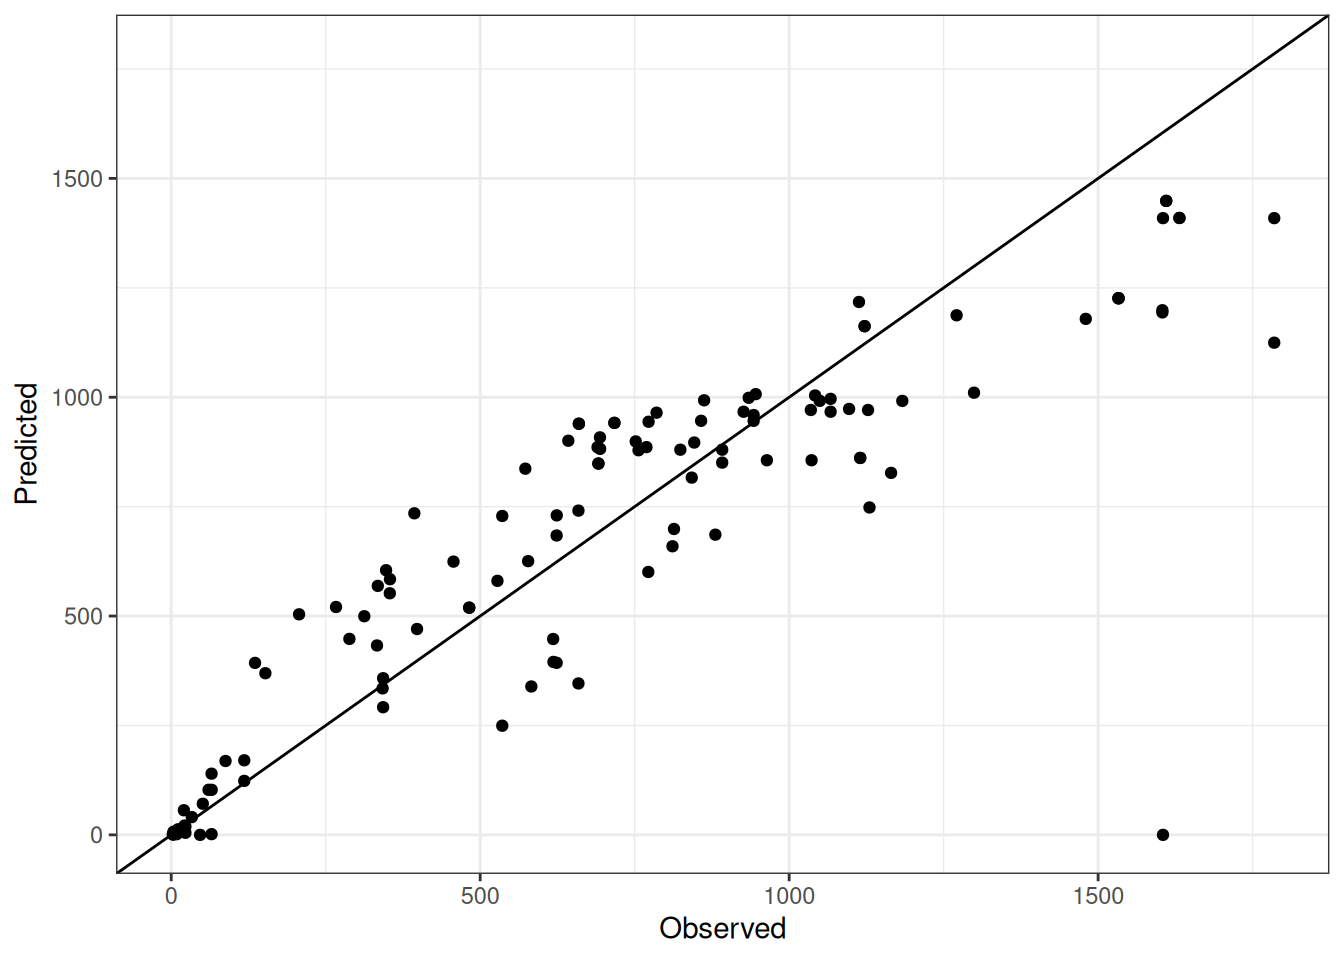
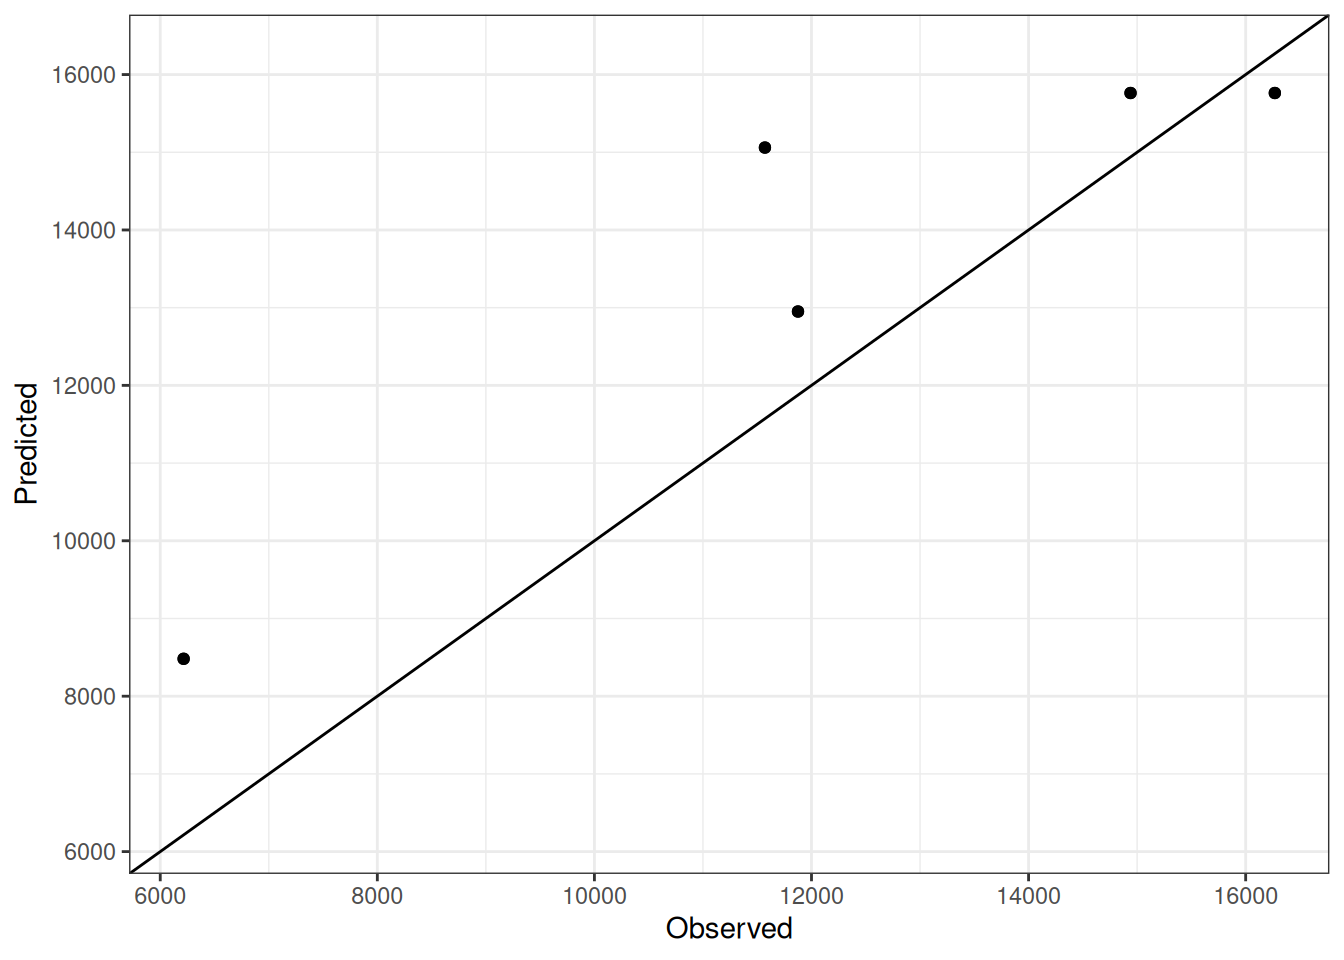
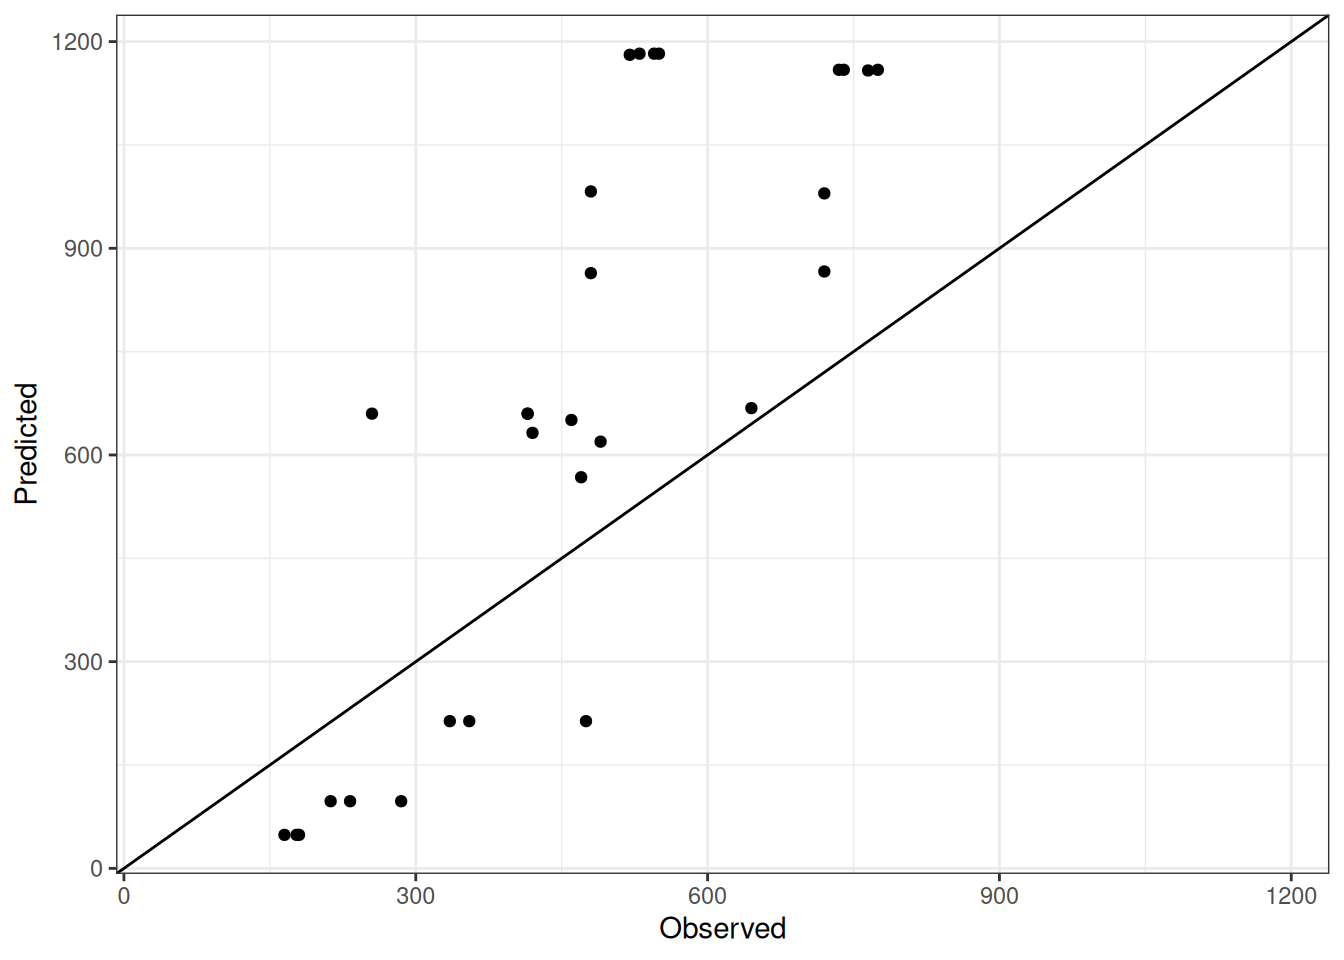
| AboveGround.Wt | 122 | 0.88 | 0.78 | 23.70 | 54703.40 | 233.89 | 0.34 | 0.93 |
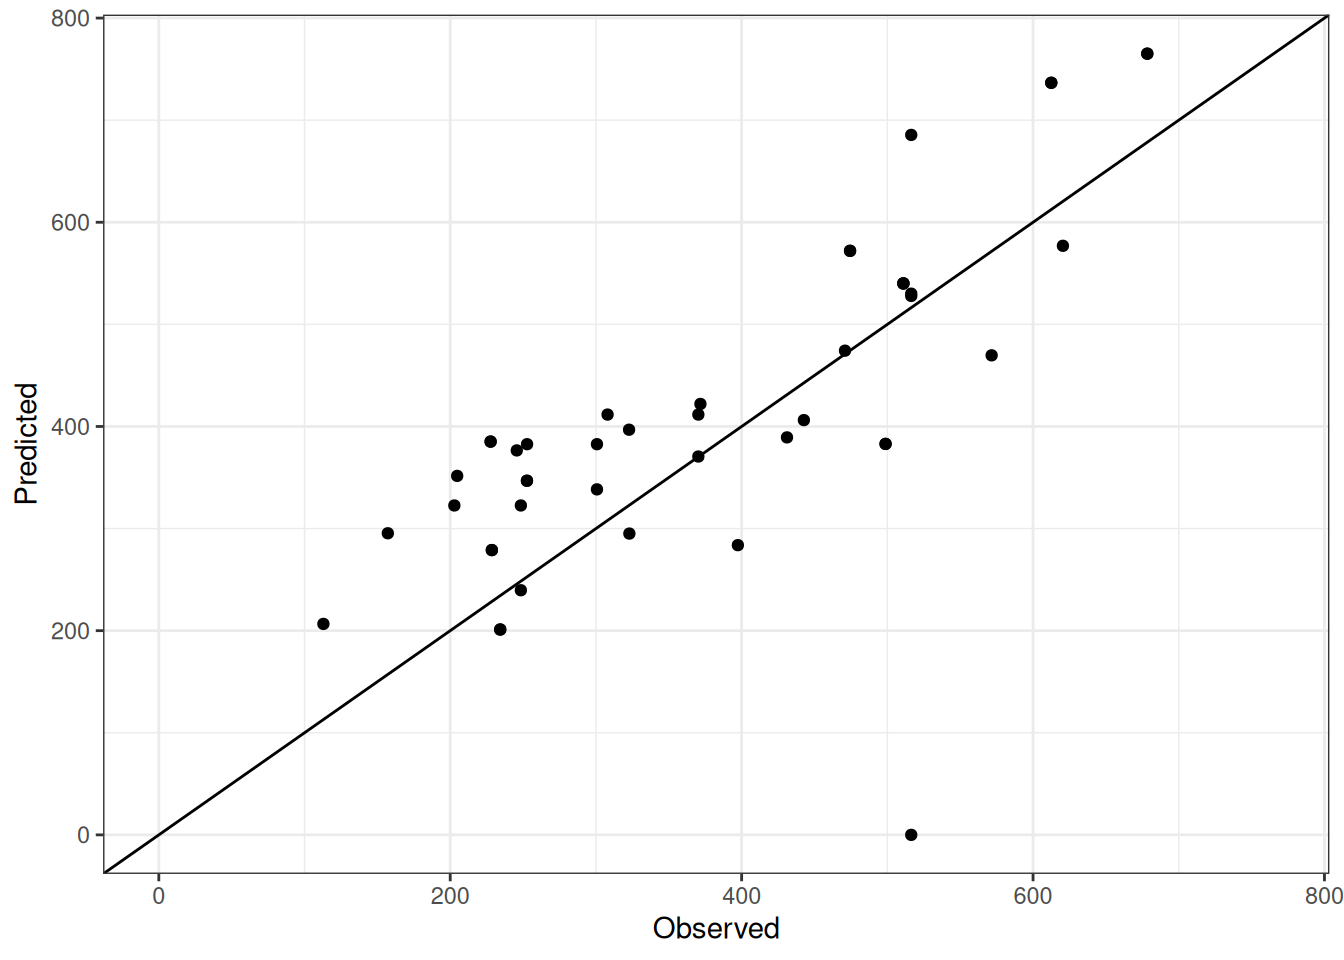
| Ear.Wt | 24 | 0.96 | 0.93 | 3.67 | 2144.95 | 46.31 | 0.27 | 0.98 |
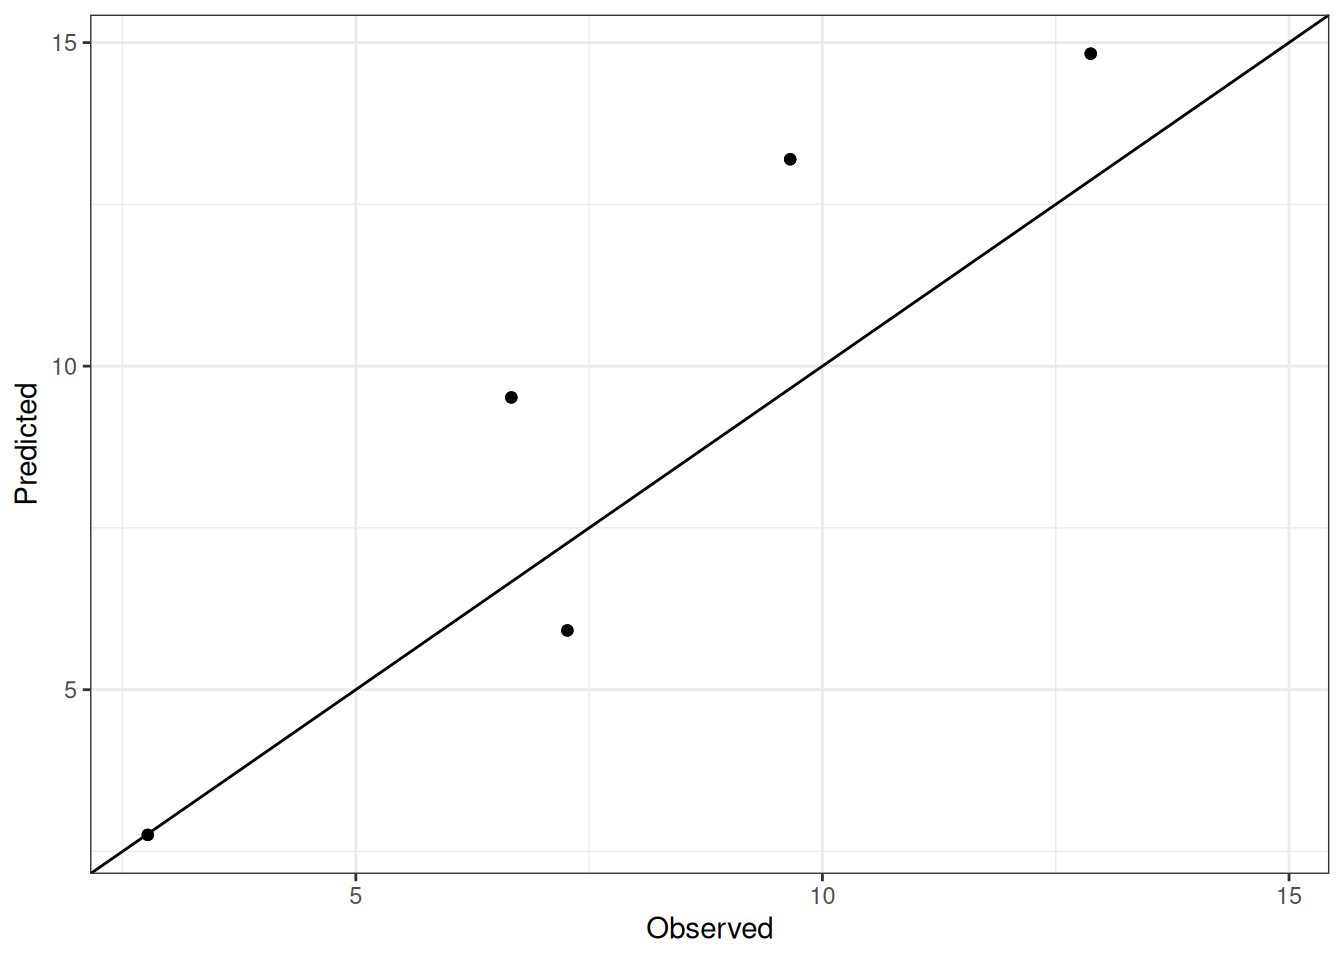
| Grain.N | 10 | 0.93 | 0.87 | -1.40 | 5.26 | 2.29 | 0.29 | 0.92 |
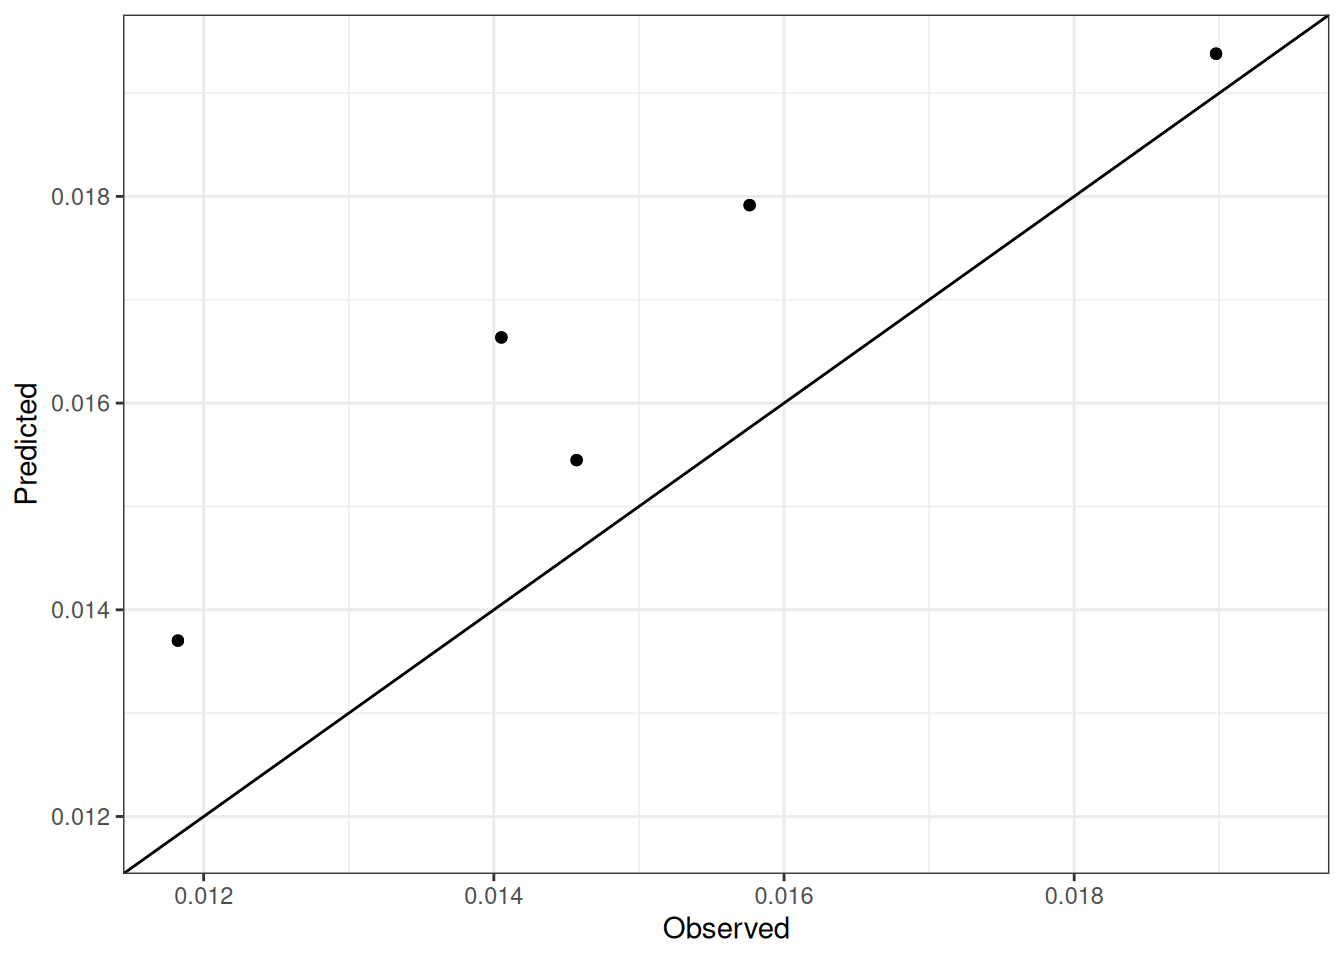
| Grain.NConc | 10 | 0.94 | 0.89 | 0.00 | 0.00 | 0.00 | 0.12 | 0.86 |
| Grain.Number | 10 | 0.93 | 0.87 | -1429.38 | 3879652.45 | 1969.68 | 0.16 | 0.91 |
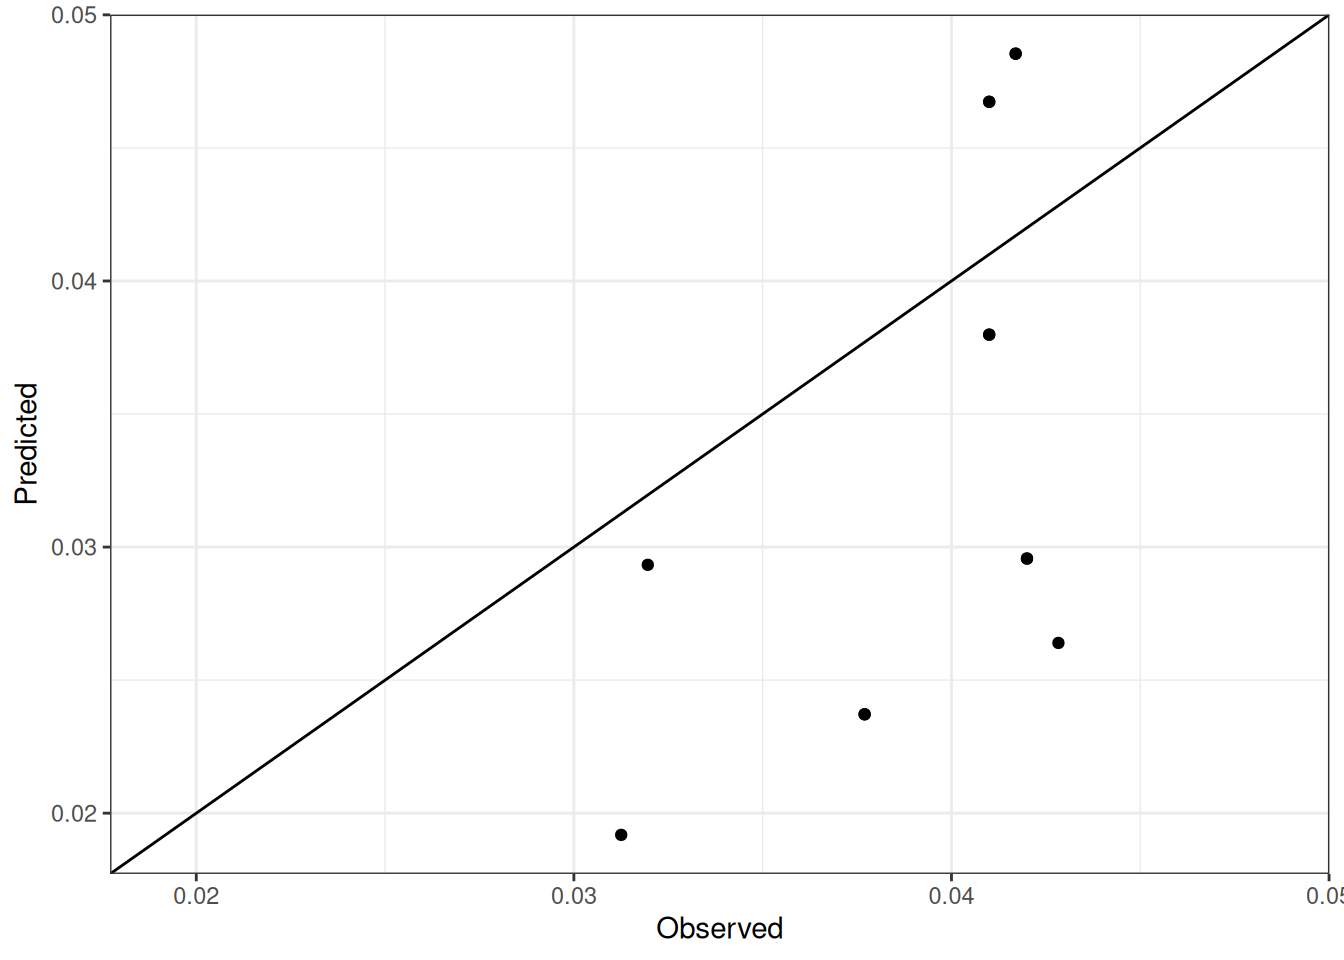
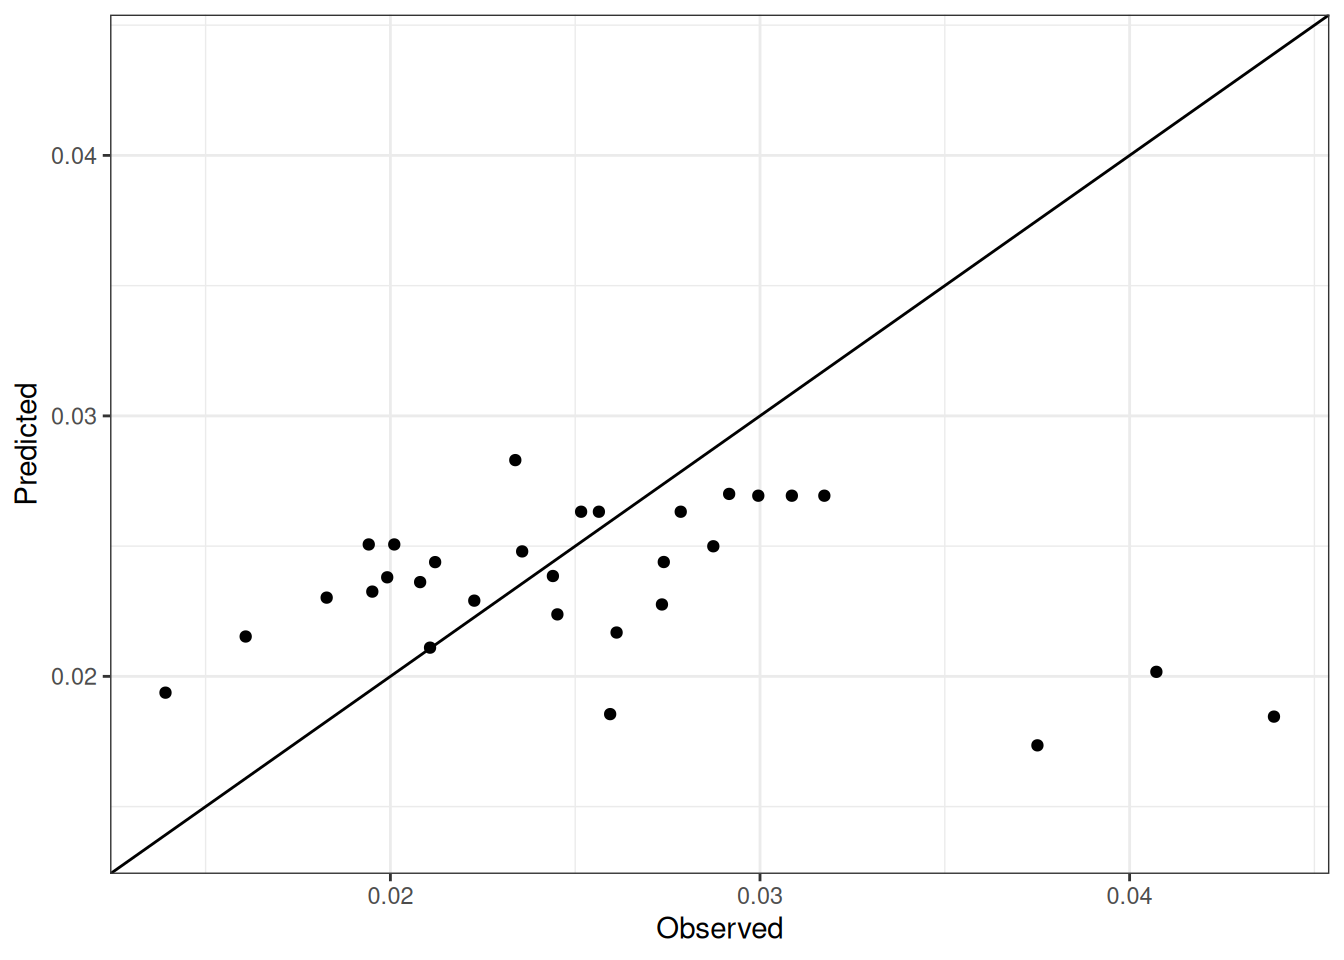
| Grain.Size | 13 | 0.54 | 0.30 | 0.00 | 0.00 | 0.01 | 0.25 | 0.53 |
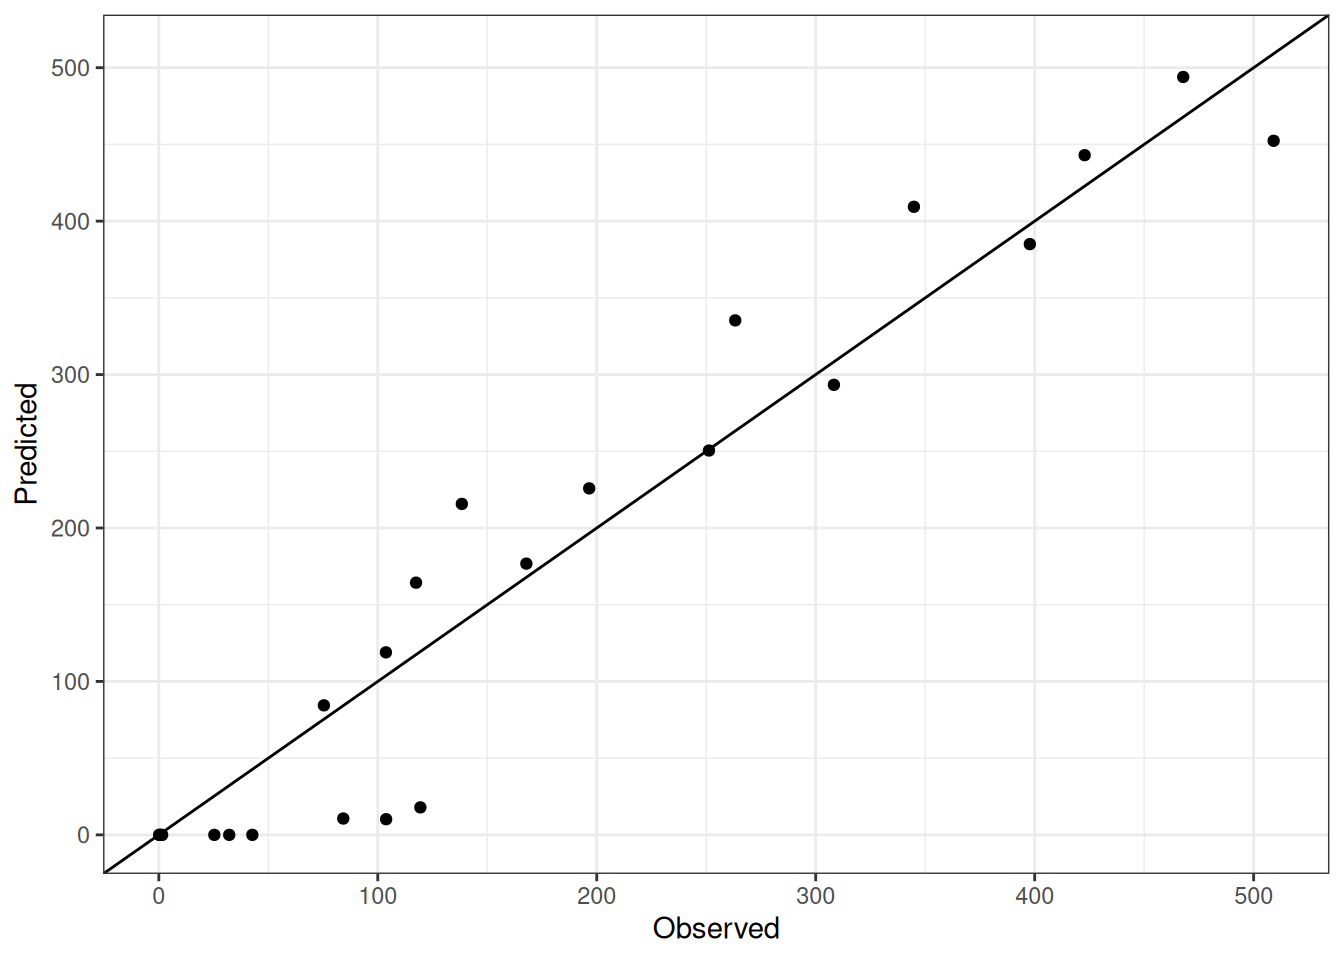
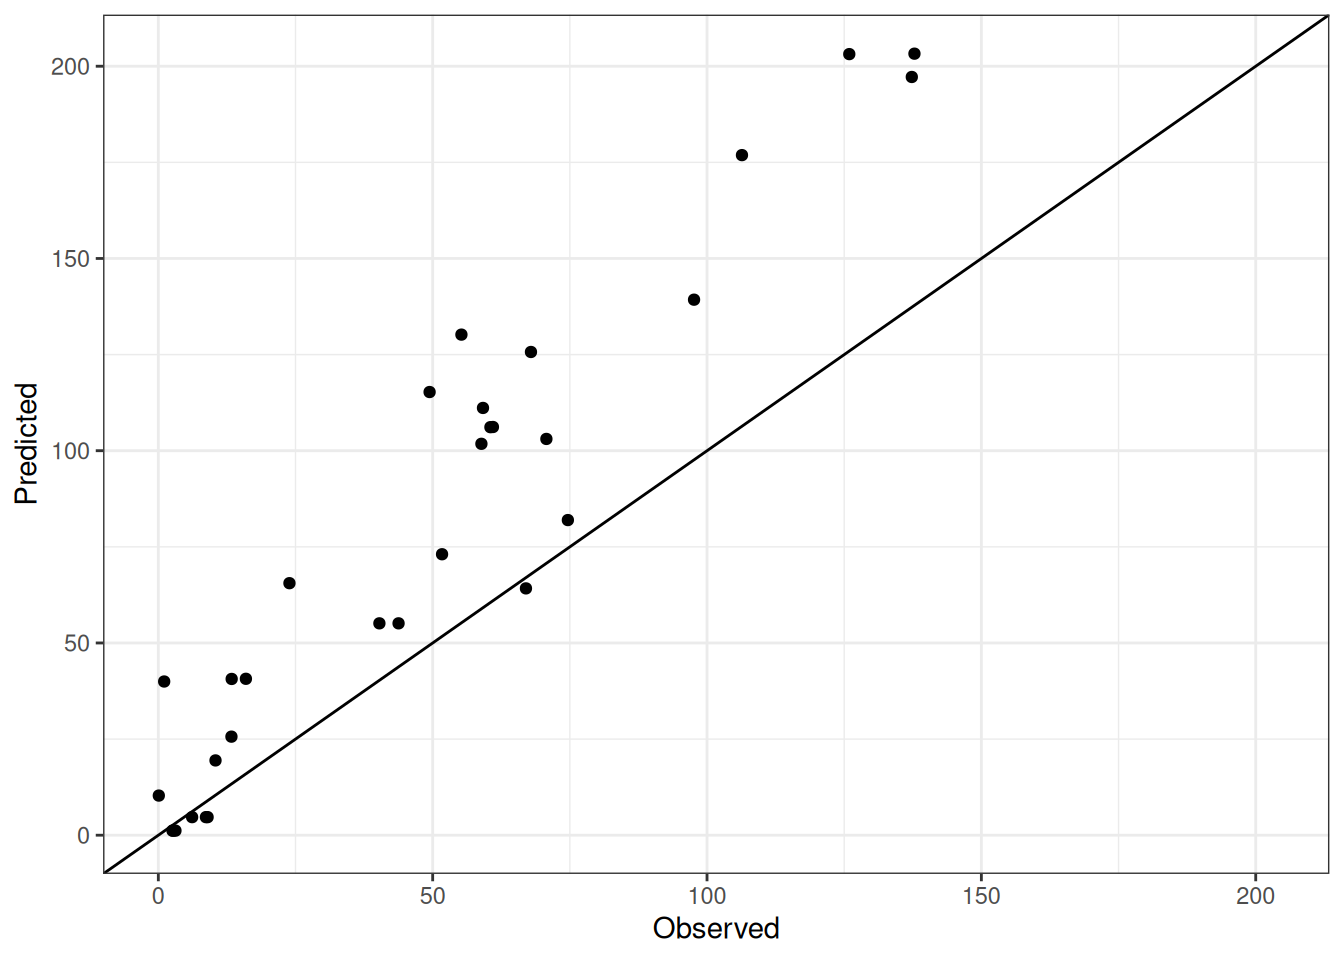
| Grain.Wt | 45 | 0.74 | 0.54 | -34.22 | 13900.47 | 117.90 | 0.31 | 0.84 |
| Leaf.Dead.Wt | 27 | 0.93 | 0.86 | 22.29 | 952.82 | 30.87 | 1.02 | 0.58 |
| Leaf.Height | 29 | 0.83 | 0.70 | -196.75 | 118083.66 | 343.63 | 0.74 | 0.69 |
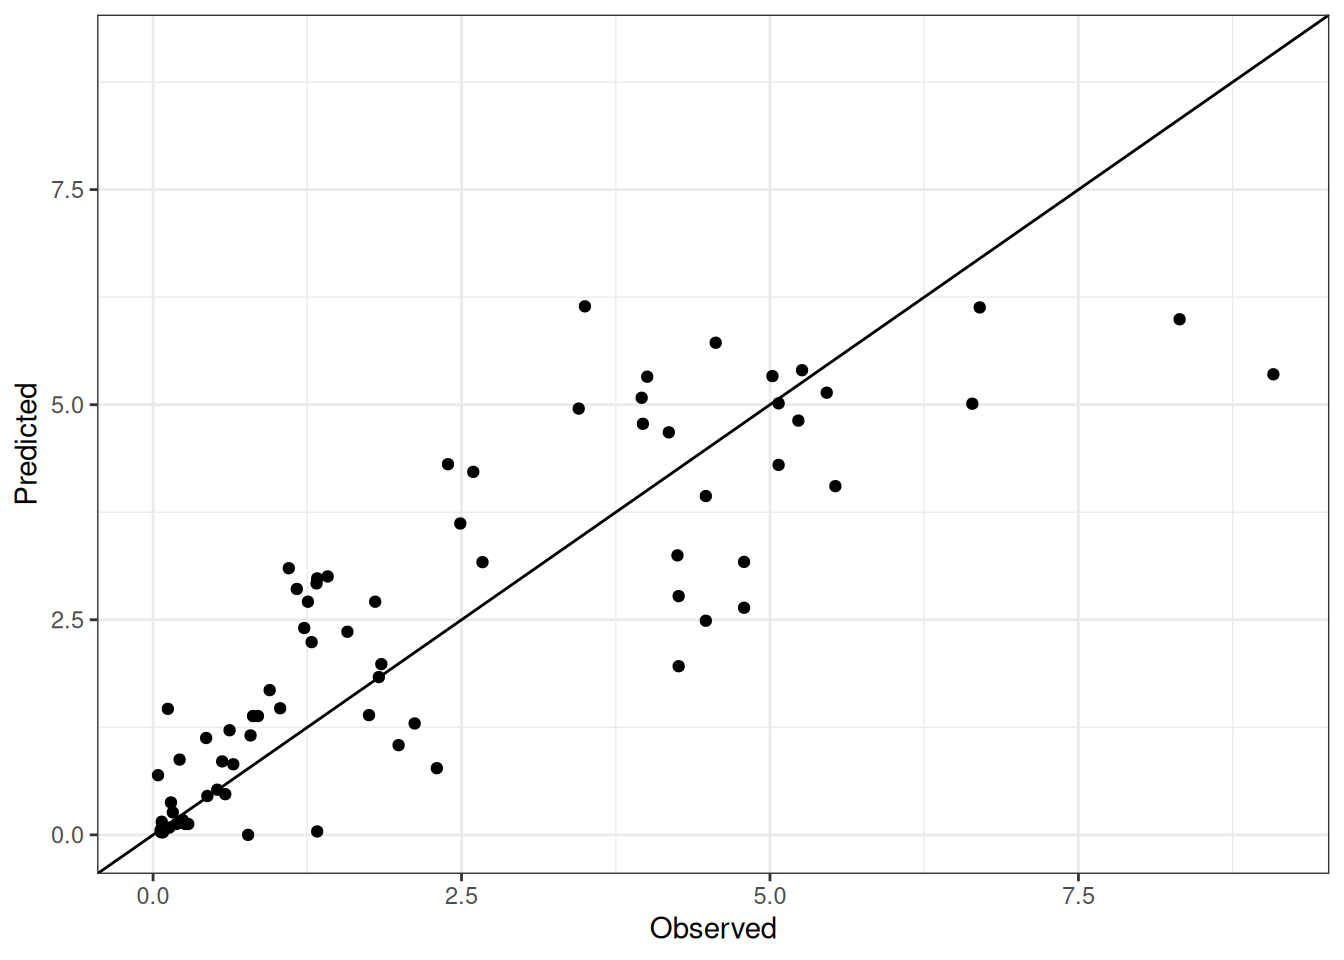
| Leaf.LAI | 75 | 0.85 | 0.72 | -0.10 | 1.33 | 1.15 | 0.50 | 0.92 |
| Leaf.Live.Wt | 31 | 0.95 | 0.91 | -30.09 | 1593.23 | 39.92 | 0.84 | 0.86 |
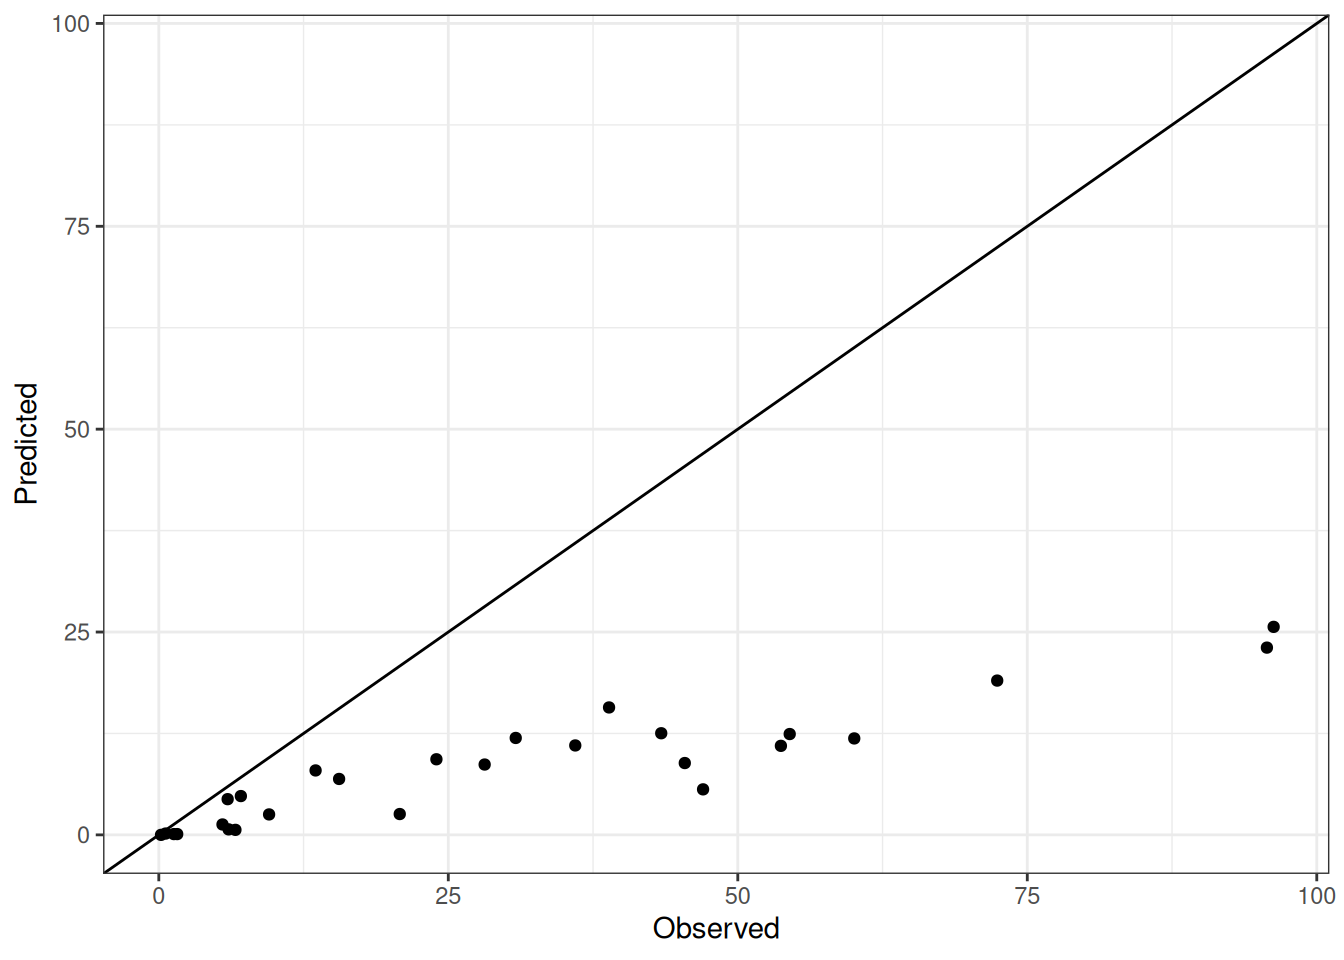
| Leaf.SpecificAreaCanopy | 30 | -0.17 | 0.03 | 0.00 | 0.00 | 0.01 | 0.31 | 0.34 |
| Leaf.Wt | 26 | 0.81 | 0.65 | -14.76 | 1424.27 | 37.74 | 0.44 | 0.84 |
| Phenology.FlagLeafDAS | 10 | NA | NA | -2.80 | 10.40 | 3.22 | 0.04 | 0.44 |
| Phenology.Stage | 91 | 0.89 | 0.79 | 1.59 | 3.94 | 1.99 | 0.31 | 0.85 |
| Stem.Wt | 27 | 0.90 | 0.81 | -135.47 | 28647.95 | 169.26 | 1.15 | 0.78 |